[Paper] GeoBeeDashboard: An Intelligent Geospatial Platform for Enhancing Waste Management in Tangerang City
GeoBeeDashboard: An Intelligent Geospatial Platform for Enhancing Waste Management in Tangerang City
This article presents an in-depth analysis of waste management practices in Tangerang City using the GeoBeeDashboard. The study involves problem identification, data collection, preprocessing, and advanced clustering analysis to assess changes in waste management from 2020 to 2023. By leveraging geospatial technology and interactive visualization, the research highlights variations in waste management efficiency across districts and provides actionable insights for improving urban waste management strategies.
To find out more analysis through python code, you can click the following colabs link :
Analysis in collabs
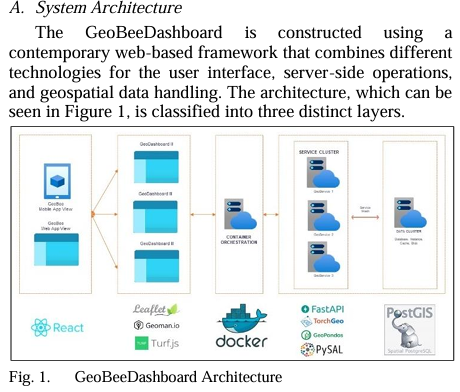
GeobeeDashboard Arsitecture :
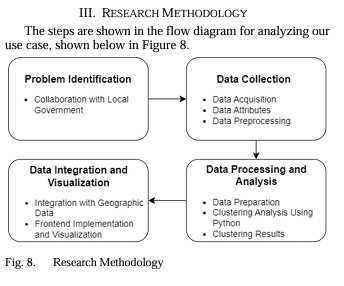
Research Methodology :
Problem Identification and Data Collection :
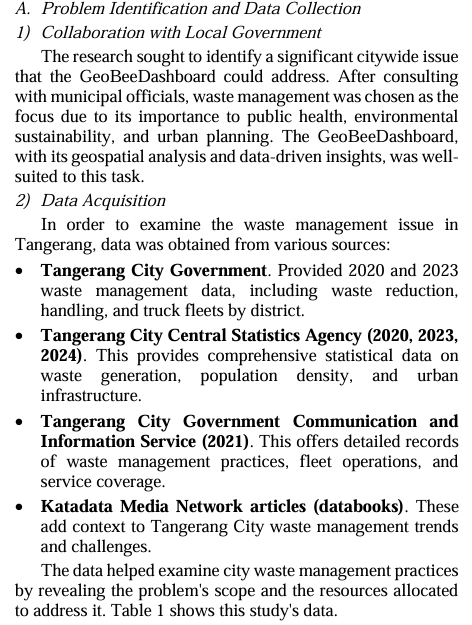
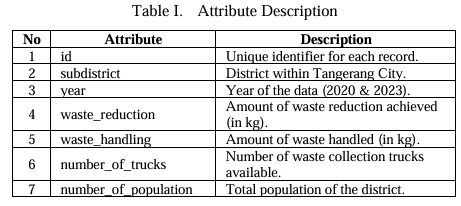
The research focused on waste management due to its critical role in public health and urban sustainability. Collaborations with local government officials identified waste management as a significant issue. Data were obtained from various sources:
- Tangerang City Government: Provided 2020 and 2023 data on waste reduction, handling, and truck fleets.
- Tangerang City Central Statistics Agency: Offered statistical data on waste generation, population density, and urban infrastructure.
- Tangerang City Communication and Information Service: Supplied records of waste management practices and fleet operations.
- Katadata Media Network: Provided articles that contextualize waste management trends and challenges.
Data Processing and Analysis :
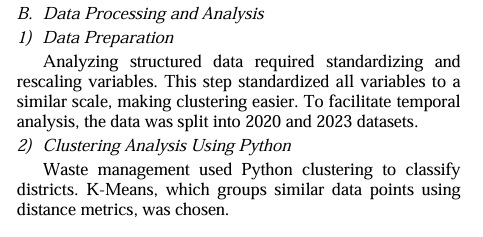
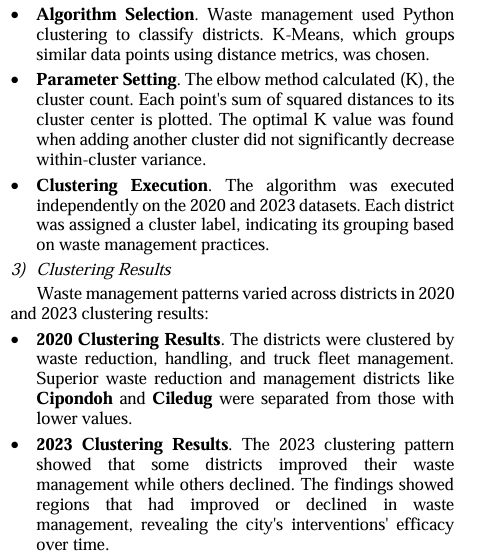
Clustering was performed using the K-Means algorithm to group districts based on waste management practices. The elbow method determined the optimal number of clusters (K). Each district was assigned a cluster label indicating its waste management performance.
- 2020 Clustering Results: Identified three clusters reflecting different waste management efficiencies.
- 2023 Clustering Results: Showed shifts in district performances, revealing areas of improvement and decline.
The Clustering Results and Visualization:
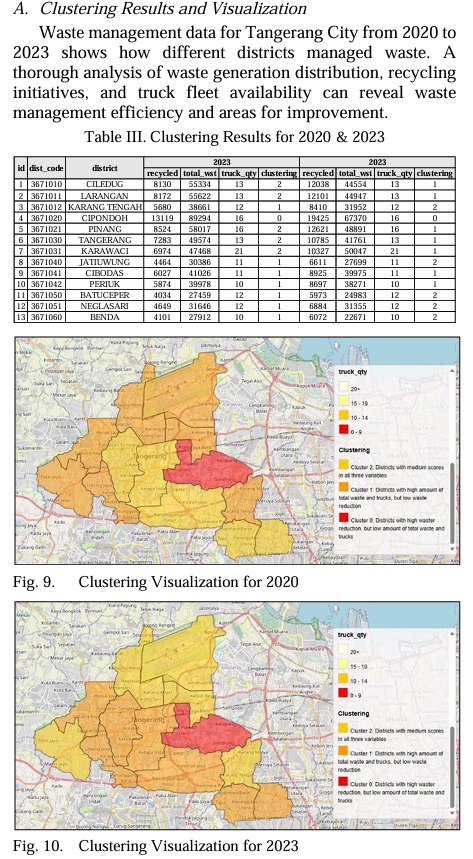
Clustering Results for 2020
- Cluster 0 (Red): Cipondoh generated the most waste (89,294 tonnes) and recycled 13,119 tonnes, supported by a fleet of 16 trucks, indicating strong waste management infrastructure.
- Cluster 1 (Orange): Jatiuwung and Karang Tengah produced less waste (e.g., Jatiuwung with 30,386 tonnes) and recycled moderately (4,464 tonnes) with 11 trucks, needing better recycling programs.
- Cluster 2 (Yellow): Ciledug, Larangan, and Tangerang had moderate waste production but struggled with waste management, requiring system improvements.
Clustering Results for 2023
- Cluster 0 (Red): Cipondoh remained dominant with 67,370 tonnes of waste and improved recycling (19,425 tonnes), indicating better waste management despite population growth.
- Cluster 1 (Orange): Tangerang, Karawaci, and Pinang joined due to increased waste without improved recycling, showing a need for better waste management strategies.
- Cluster 2 (Yellow): Jatiuwung and Batuceper showed better waste management balance but still needed improvements to avoid returning to higher waste levels.
Cluster Transitions
- Yellow to Orange: Indicates districts with rising waste production but insufficient waste management improvement.
- Orange to Yellow: Shows districts that stabilized or improved their waste management.
- Red Cluster Remaining: These districts consistently generate high waste and need urgent interventions to improve waste management.
